Calculus Lab: 2/15/2022
Overall objective: To explore secant, tangent and limit concepts, and to learn how to work with them in various application contexts.
(I) Secant line approximations to rates of change
In many situations we want to estimate the rate at which something is changing (as we will see in the experiment described below). In calculus terms, this amounts to finding the slope of the tangent that touches the graph at the point of interest. But, with real-world data, the tangent slope is often difficult or impossible to find exactly. In such situations, we use a secant line approximation to the tangent.Shown in the graph below is the povery percentage in the U.S. between the years 1990-2010. The data is from the U.S. Census Bureau, and it shows a gender breakdown of povery rates. The graph also shows continuous quadratic approximations to the data for each sex.
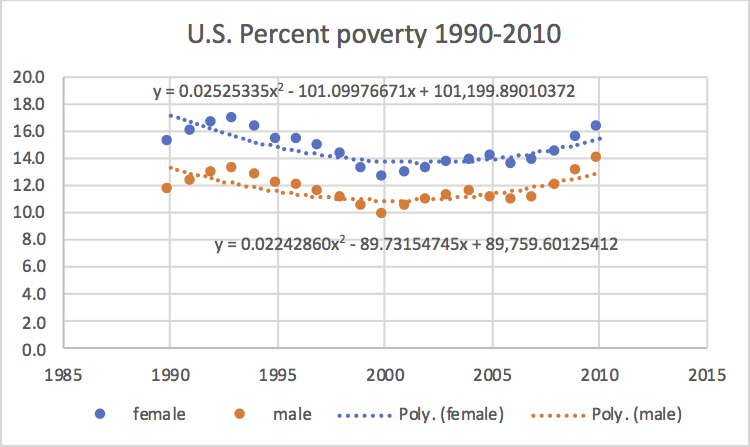
We want to compare the rate at which poverty is changing
for females vs males near the end of the time period shown.
Use the quadratic approximations for each sex and find the
slope of the secant line that connects the
following pairs of points:
(i) \(x\)=2009 and \(x\)=2010, (ii)
\(x\)=2009.5 and \(x\)=2010
(iii) \(x\)=2009.9 and \(x\)=2010.
From these slopes, estimate the rate at which the percentage
of poor was changing for females and males in the year 2010.
[NOTE that you will need to use all the digits of
precision shown for the \(x^2\) term in the quadratic
approximations to get reasonable results. For the other terms,
a couple of digits is sufficient.]
Write a short discussion that summarizes what this experiment teaches about how to estimate approximate rates of change. Address how/whether it is possible to increase the accuracy of your approximations to any desired level. Be sure to also include a statement of the problem, the strategy used for solving it, and show needed calculations to support your discussions. If it will help make your discussion clearer (or shorter!) feel free to include a sketch or graph or other visuals.
(II) Limits using numerical methods
Often (but not always) we can find limits numerically, which means we systematically plug in successive \(x\)-values closer and closer to the point of interest and observe the \(y\)-values. From the trend in the \(y\)-values one can sometimes guess the limit. It is prudent to consider \(x\)-values on both sides (right and left) of the specific \(x\) at which we want the limit. The idea is to keep trying smaller and smaller \(x\)-values till the answers (\(y\)-values) converge.For example, if we want to find the limit of \(f(x)\) as \(x\) approaches 2, we could try to estimate the left limit by evaluating \(f(1.9), f(1.99), f(1.999), f(1.9999),\) etc. Likewise, the right limit might be estimated by computing \(f(2.1), f(2.01), f(2.001), f(2.0001),\) etc. Of course, we could also vary the last decimal, like \(f(2.1), f(2.05), f(2.006), f(2.0001),\) etc. Does it matter? You decide!
Explore the numerical strategy for the following limit problems:
(a) Find the limit as x approaches 0 for \(\displaystyle f(x)=\frac{\sin(\pi x)}{x} \)
(b) Find the limit as x approaches 1 for \(\displaystyle f(x) =\frac{ (x^3 - 1)^{4/3} }{ (x - 1)} \)
(c) Find the limit as x approaches 0 for \(\displaystyle f(x) = \sin\left( \frac{\pi}{x} \right) \)
For each problem, create a table showing \(x\)-values in column 1 and \(f(x)\) values in column 2.
After that, write a paragraph (or two!): (1) Describing the numerical strategy you used. (2) Explaining why you think the strategy works. (3) Interpreting your results shown in each table and guessing the value of the limit. (4) Commenting on the pros & cons of this strategy.
Some feedback after seeing student work
To clarify the numerical strategy for computing limits, here is a Sage script that does the computations with random last digit for any given problem.
To try the other problems, simply replace "a" and "f(x)" in line 2 of the above code with the correct values for those problems.
Moral of the story?
You must always vary the last decimal place, if you want to play it safe!